
Reports
Up-to-date reports, delivered on your schedule
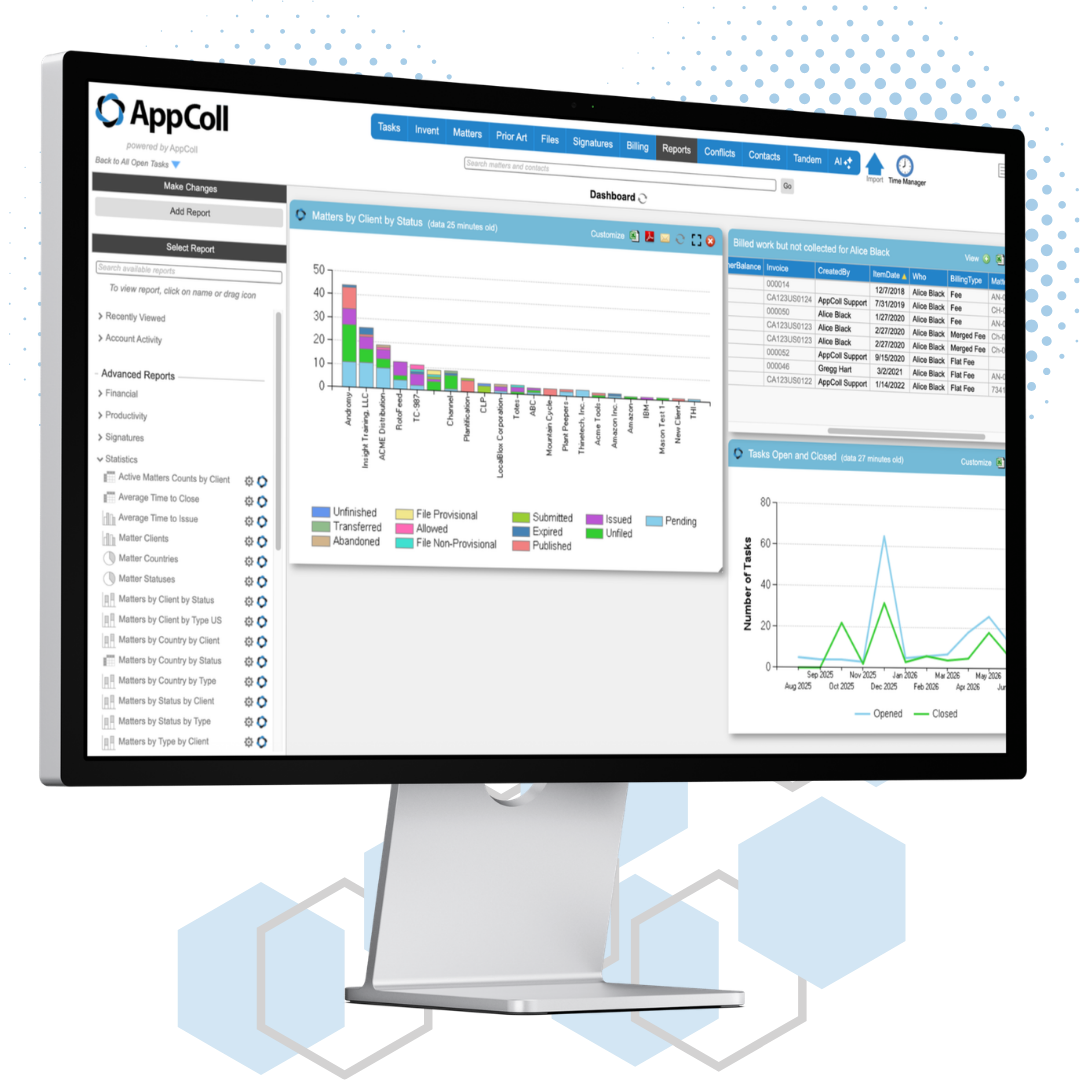
The AppColl® Reports Module allows users a convenient place to store all reports and views.
Generate unlimited and customizable bar, graph and pie charts aggregating your data for advanced reporting. Some examples include: number of disclosures filed per inventor per month, percentage of disclosures that convert to patent application filed per product line, number of issued patents per country, average time from disclosure submission to filing by law firm, and invention awards per inventor per year.
Drag, drop and resize charts to customize your dashboard reporting view. Automatically schedule reports to be emailed to numerous parties.
How reports work
1
Build from any module
Set your filters, columns and sort order, then save the view as a report. Create a docketing report from Tasks, a portfolio report from Matters, and so on.
2
Run on demand
Pick a saved report and get current results instantly. Save them as a PDF or CSV, or send them by email.
3
Schedule delivery
Send reports at set intervals by email, as attachments or directly in the email body. Reports can also go to FTP, SFTP or an Amazon S3 bucket.
Reports Module Features
Manage Report Schedules
AppColl allows you to customize how you view and receive reports. Set up reports to send automatically based on day, time, client, format, etc.
Query Based Reporting
All reports are based off saved database queries. Always have up to date reports at the click of a mouse.
Flexibility
The Reports Module gives users flexibility to customize their reports using different formats and notification options.
Charts and dashboards
Advanced graphical reporting turns your AppColl data into charts you can arrange on a dashboard and share with your team.
Line, bar and pie charts
Aggregate data across matters, tasks, billing and inventions.
Custom dashboard
Drag, drop and resize charts into the layout you want to see.
Charts in scheduled emails
Send charts as PDF attachments or embed them in the body of the email.
Advanced Reports included
A library of ready-made reports, organized by module, comes standard with PM Plus and Invention Manager.
More reporting tools
30/60/90 day docket reports
Filter tasks by respond-by date and owner to build a docket report for any window.
One report for everyone
Filter on the current user, and each person who runs the report sees only their own results.
Affiliated reports
Partners can see their own docket plus the tasks of the working attorneys on their matters.
Private reports
Keep personal reports out of the shared list so everyone's report menu stays manageable.
Activity logs
Account Activity reports give a line-by-line record of every change made in your account.
Edit and reuse
Change a saved report's filters, columns or ordering at any time and save it again.